The Stock vs. Options Dilemma
Buying 100 shares of AAPL at $200 = $20,000 investment
Buying 1 call option might cost $1,500
Which one makes more money if AAPL goes up 15%? What if it only goes up 5%? Or takes 6 months instead of 3?
Compare potential returns between stocks and options. Simulate scenarios. Make informed decisions.
Every investment decision has an opportunity cost. Without proper analysis, you're leaving money on the table.
Buying 100 shares of AAPL at $200 = $20,000 investment
Buying 1 call option might cost $1,500
Which one makes more money if AAPL goes up 15%? What if it only goes up 5%? Or takes 6 months instead of 3?
Options contracts lose value every single day through theta decay.
A 90-day option and a 365-day option behave completely differently.
Without simulation, you're flying blind.
"I think the stock will go up" is not a strategy.
The Options Screener helps you discover options contracts that match your market thesis by simulating potential returns before you buy.
Save contracts you own or are considering, track performance over time, and simulate how they would perform under different market conditions.
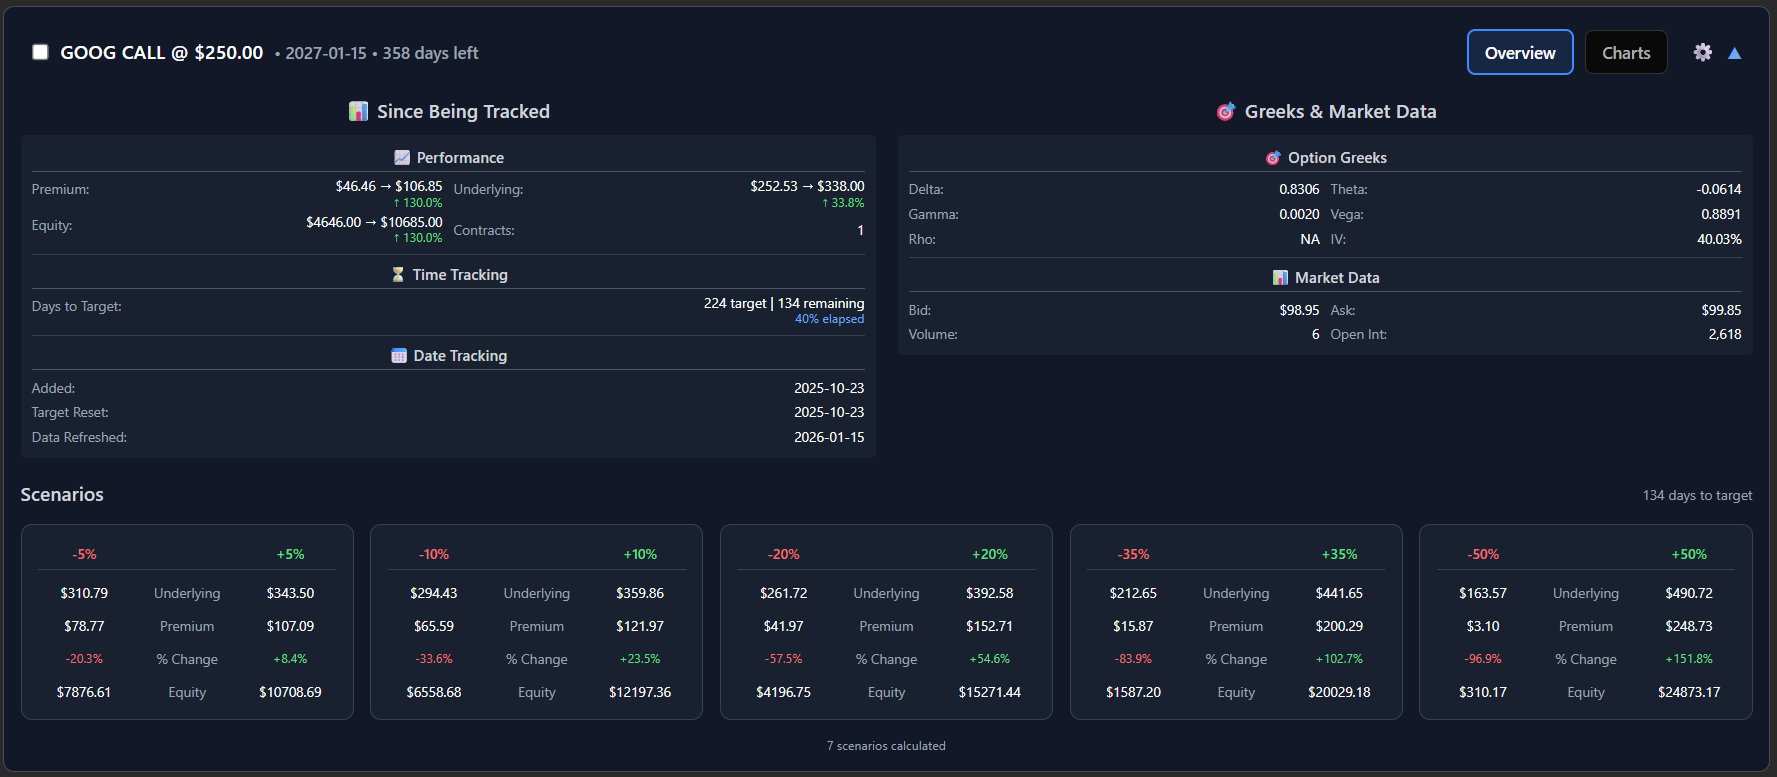
Each saved contract shows performance under 7 scenarios:
+/-5% • +/-10% • +/-20% • +/-35% • +/-50% • +/-100% • +/-200%
See both upside potential and downside risk at a glance.
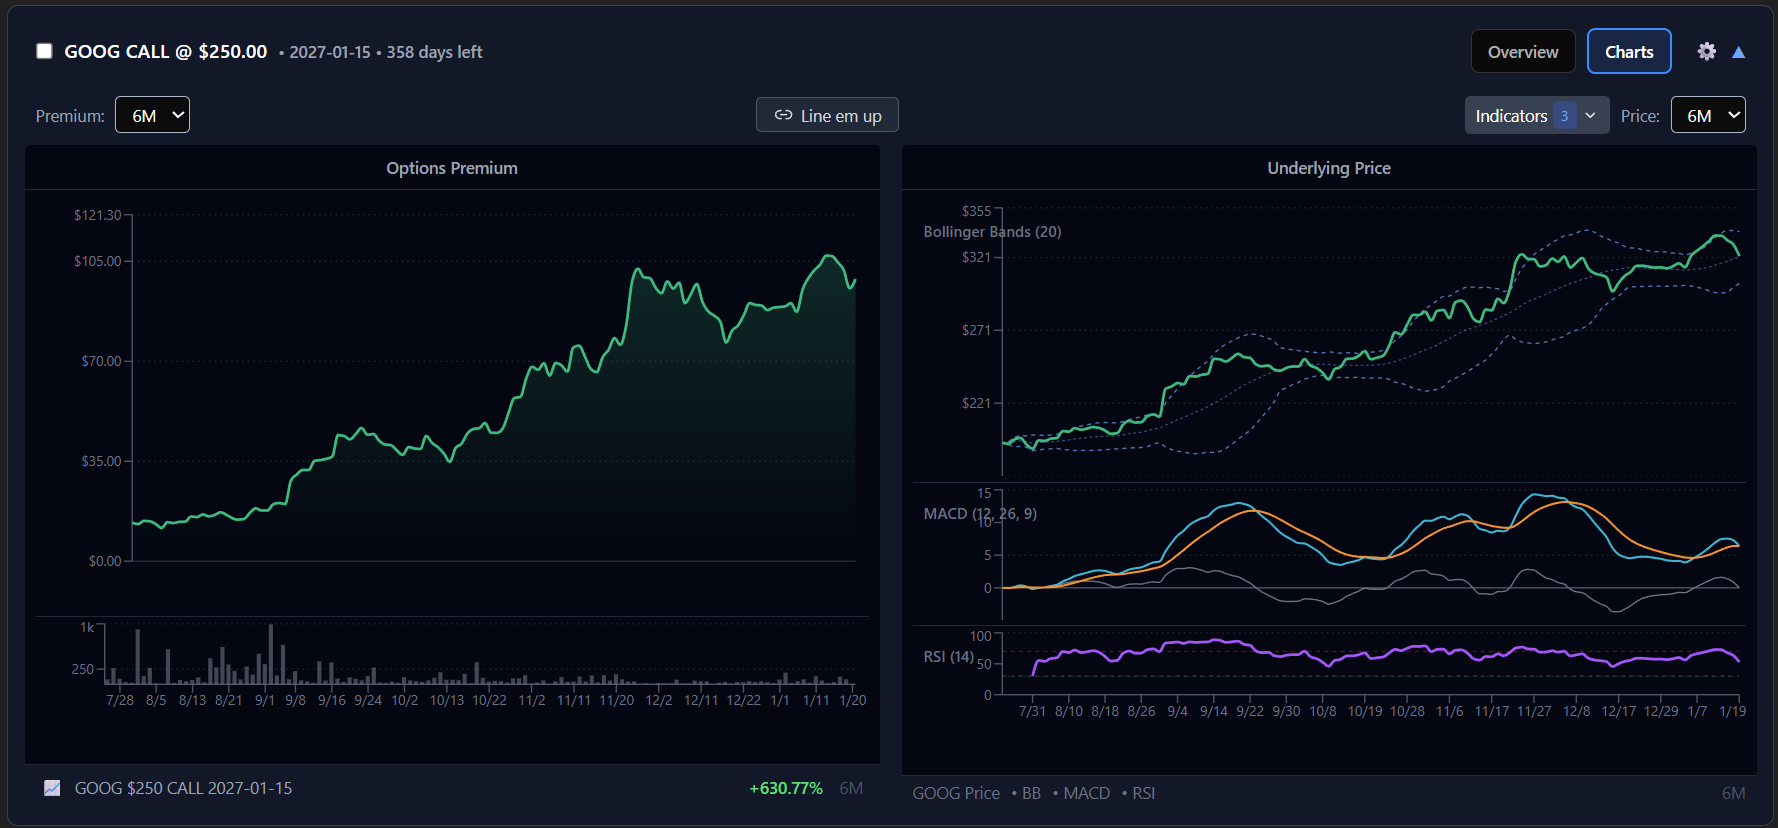
View historical option premium prices alongside the underlying stock. Understand how your contract's value has changed over time.
"I want to try options but don't know where to start."
"I want to amplify my returns without betting the farm."
Perfect for: Long calls on stocks you're already bullish on
"I need a faster way to screen contracts."
"I want to compare scenarios without spreadsheets."
Perfect for: Swing trading options, earnings plays
"I want leveraged exposure with minimal time decay."
"I'm looking for stock replacement strategies."
Perfect for: Deep ITM LEAPS as stock alternatives
Every analysis shows projected values under your specific scenario. Not just current prices — future prices based on your thesis.
Watchlist shows 7 different outcomes simultaneously. Understand your best case AND worst case before committing capital.
Real-time market data for accurate analysis. Greeks calculated using industry-standard Black-Scholes pricing model.
Track actual P&L against what you paid. See percentage change from your entry, not just market price.
See all Greeks (delta, theta, gamma, vega, rho). View bid/ask spreads, volume, open interest. Export everything to CSV.
No bloat, no unnecessary features. Built specifically for the stock-vs-options decision that every investor faces.
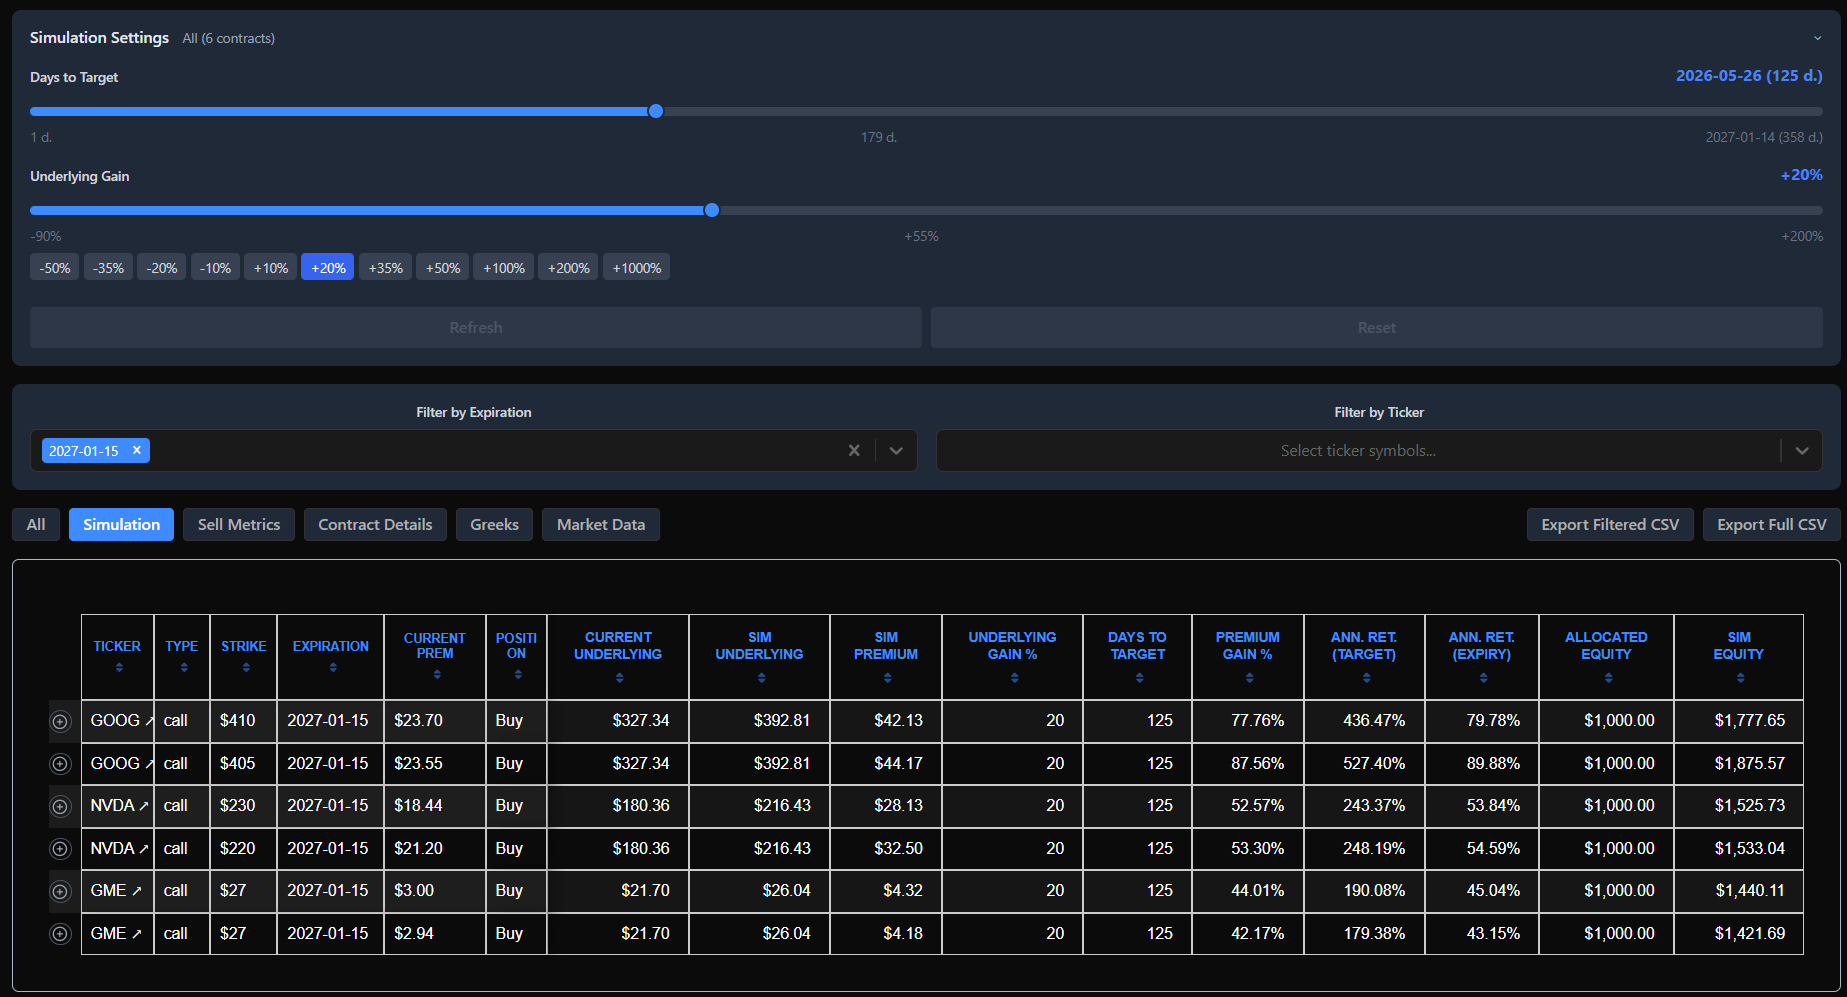
Options Leveling is a trading analysis platform that helps investors compare potential returns between buying stocks and buying options contracts. It simulates how your investment would perform under different market scenarios using Black-Scholes pricing, helping you make data-driven decisions about where to allocate capital.
The screener lets you input your expected stock movement (e.g., +20%) and timeframe (e.g., 90 days), then finds options contracts that match your thesis. It calculates projected returns using Black-Scholes pricing and displays results sorted by potential gain percentage. You can compare ITM, ATM, and OTM strikes across different expirations.
Theta decay (also called time decay) refers to the daily loss of value in an options contract as it approaches expiration. Options are wasting assets — they lose value every day simply due to the passage of time, even if the underlying stock price remains unchanged. Theta decay accelerates as expiration approaches, which is why shorter-term options are riskier than LEAPS.
LEAPS (Long-Term Equity Anticipation Securities) are options contracts with expiration dates more than one year away. They experience less theta decay than short-term options because time value erodes more slowly with longer durations. LEAPS are often used as stock replacement strategies, allowing investors to control 100 shares with less capital than buying the stock outright.
ITM (In The Money): For calls, when the strike price is below the current stock price. For puts, when the strike is above the current price. ITM options have intrinsic value.
ATM (At The Money): When the strike price equals or is very close to the current stock price.
OTM (Out of The Money): For calls, when the strike is above the current stock price. For puts, when the strike is below. OTM options have no intrinsic value, only time value.
The Greeks are metrics that measure different sensitivities of an option's price:
Yes, Options Leveling offers a free tier that gives you access to core screening and watchlist features. Premium features for serious traders are also available for those who want advanced capabilities and higher usage limits.
Simulations use the Black-Scholes pricing model, the industry-standard formula for options valuation. While no model can predict the future perfectly (implied volatility changes, for example), Black-Scholes provides mathematically sound projections based on your specified scenarios.
Key terms every options trader should know
Select the plan that best fits your trading needs
Get started with basic features
For active traders
For serious traders
Unlimited everything